
AI image analysis for materials and life science
Your microscope sees pixels. We see answers.
SciSpot connects the whole lab workflow for R&D and QC teams across Europe: capturing images from any type of microscope, AI image analysis, statistics and a signed, traceable result. One partner delivers, deploys and supports it all.
Know us from your invoice? We are the specialist partner that delivers, supports and renews your scientific software under your existing agreement.
Mean grain diameter per sample (µm)
Example data for illustration
Where we have presented
The whole workflow
Four tools, four vendors, four support numbers. Or one workflow.
Buying each tool separately gets you good software with gaps in between. We are not tied to one brand. We pick the tools that fit your samples and your rules, connect them into one automated chain, and build AI and deep learning models trained on your own images. Tedious, subjective manual work is replaced by accurate, automated measurement on every batch.
Imaging & lighting
- Camera chosen without the analysis in mind
- Lighting that changes with the weather
- Every operator, a different set-up
- Microscopes and cameras
- Lighting boxes and illumination
- Imaging set-up and calibration
AI image analysis
- Generic settings, tuned by hand
- Thresholds that vary between users
- One image at a time
- Custom AI and deep learning models
- ASTM & ISO methods: E112, E1382, E45, ISO 643
- Automated batch analysis
Statistics & SPC
- Results re-typed from exports
- Charts updated when someone has time
- Trends spotted after the batch has shipped
- Control charts and capability
- Design of experiments
- Publication-quality graphs
Audit trail & signatures
- Validation as a separate project
- Gaps wherever data leaves a system
- Weeks of preparation before an audit
- GLP, 21 CFR Part 11
- EU GMP Annex 11
- Locked method versions
4 suppliers, 4 contracts, 4 support numbers1 partner, 1 support line, 1 automated workflow
Each tool works. The gaps between them are yours to manage.The connections are our job. Your team gets the result.
- Choosing the tools
- Limited to what each vendor sellsThe best fit for each step, whatever the brand
- Moving data between steps
- Manual, on every batchAutomated, on every batch
- Audit trail
- Stops at every exportContinuous from image to signature
- When something breaks
- Each vendor points at the next oneOne support team that knows the whole chain
Start with any single step and add the rest when you are ready.
Why automate
What an automated workflow gives you
Results you can repeat
Every image is measured with the same locked method, so results do not depend on who is at the microscope or what day it is.
From image to decision, faster
Batches move from capture to control chart without anyone exporting, pasting or re-typing. Out-of-spec results show up while you can still act on them.
Audit-ready by default
Every number links back to its image, its method version and the person who signed it. Audits become a search, not a project.
Free to choose the best tools
We select the products that fit your samples and budget. When your needs change, one step can be replaced without rebuilding the rest.
Experts back on the science
Your engineers spend their time interpreting results and improving processes, not moving files between programs.
Scales with your sample volume
Ten images or ten thousand, the chain runs the same way. More samples do not mean more manual work.
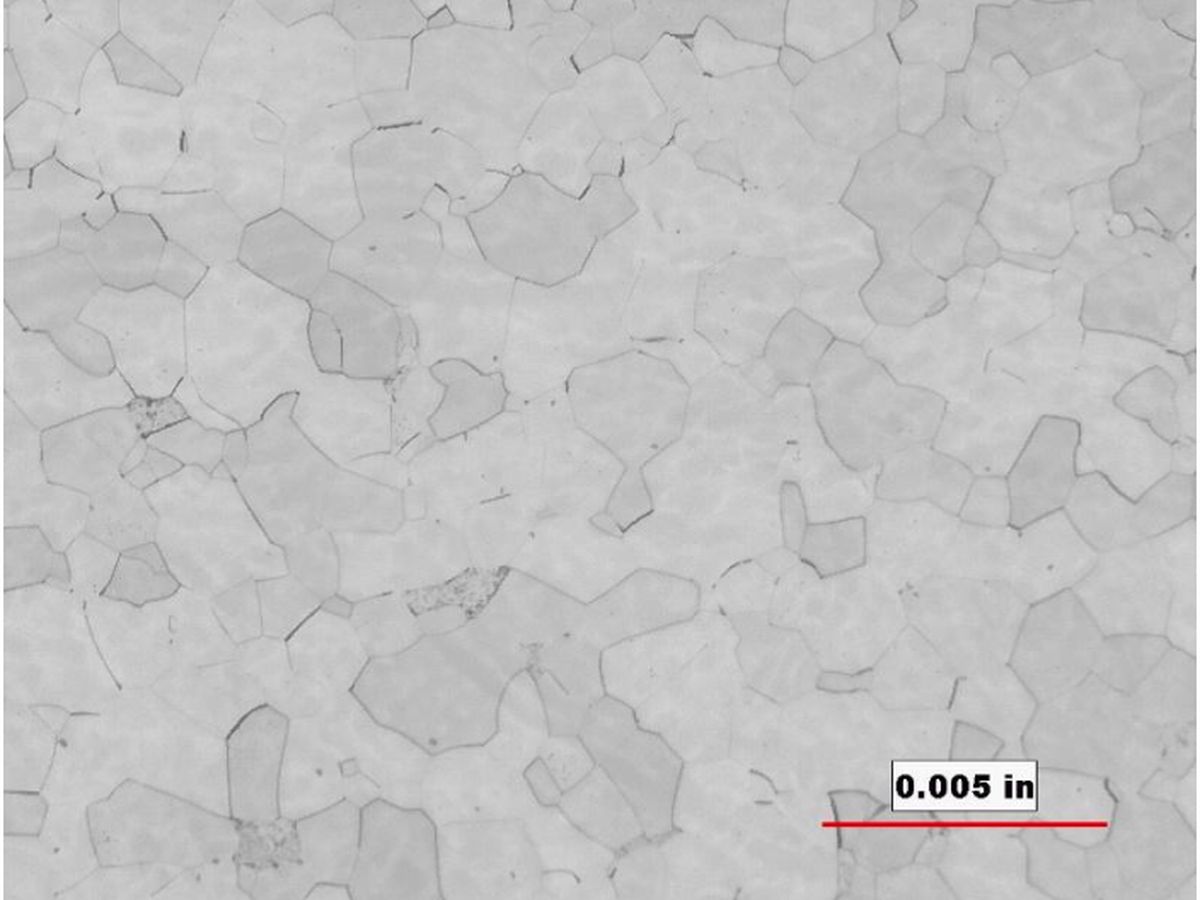
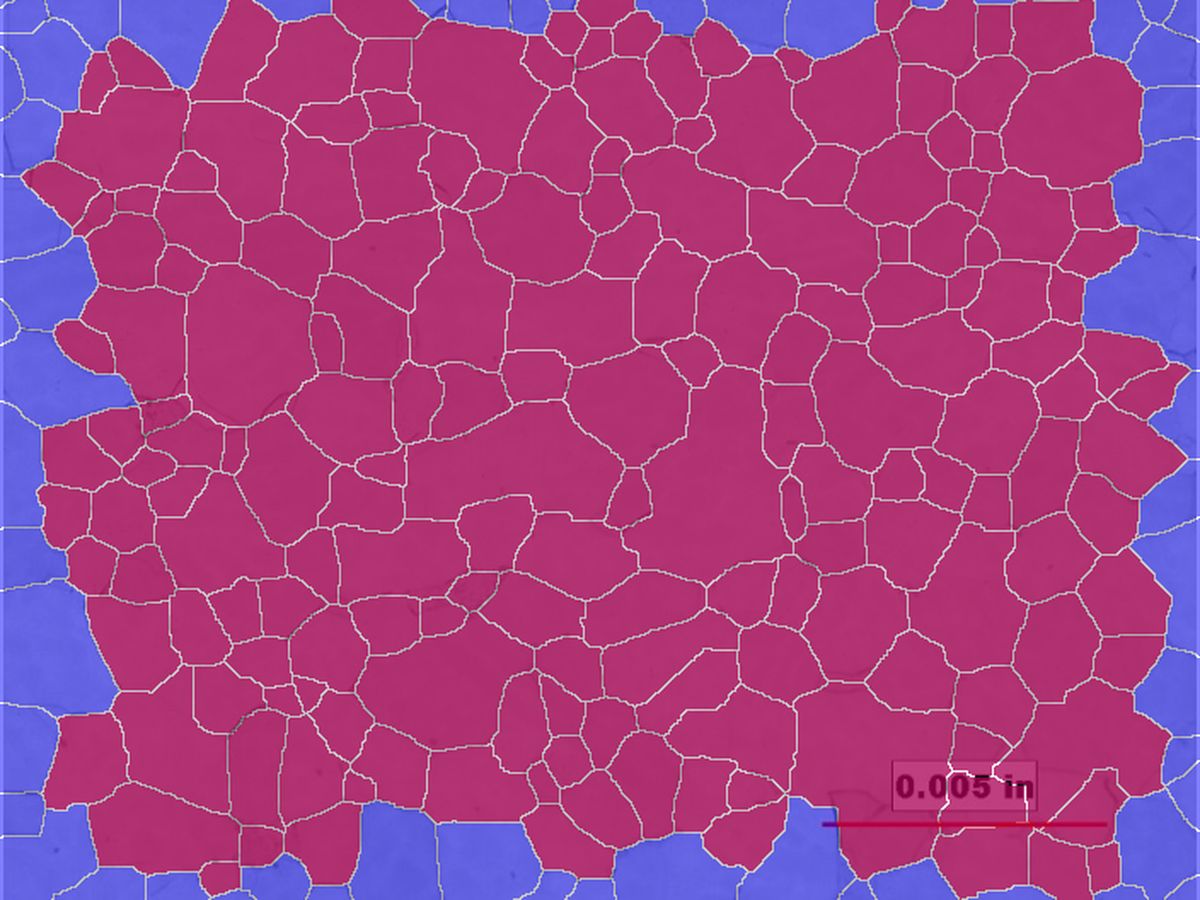
Image analysis
Image analysis for every type of microscopy, and beyond
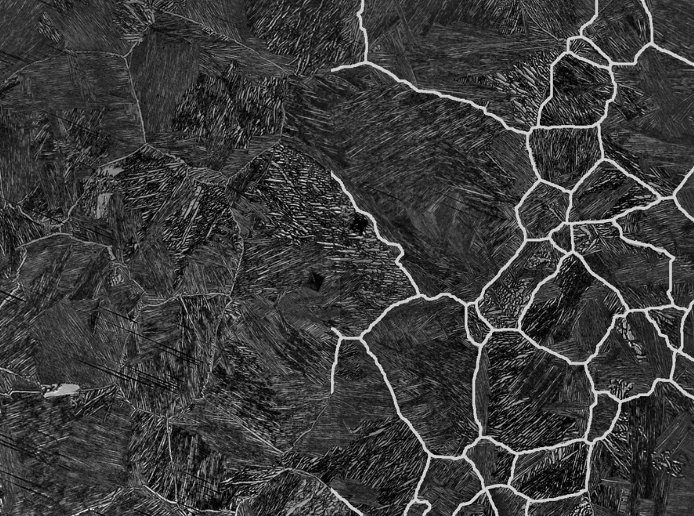
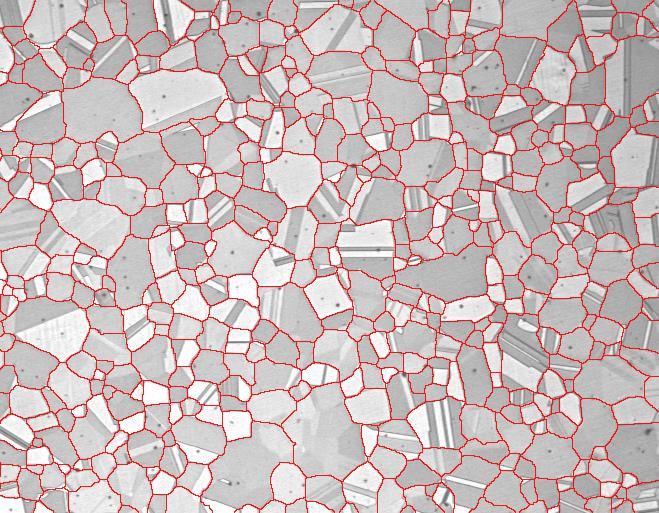
We start with the measurement you need, then pick the right tool for it. Real analyses, not stock photos: drag the slider to compare.
Microscopy
Flagship · MIPAR →Light optical (LOM), SEM, TEM and confocal: microstructures, particles, fibres and cells, from single images to whole sample series.
3D and CT
Volumes from X-ray CT and serial sectioning: pores, phases and networks in three dimensions.
Spectral and hyperspectral
Chemistry in every pixel, for sorting, identification and quality grading.
Camera and lab photos
Petri dishes, well plates and bulk samples photographed with a standard or DSLR camera.
Aerial and satellite
Large-area imagery for forestry, inspection, geology and the environment.
Data compliance
An auditor should be able to follow every number back to its image
Regulated labs need more than accurate results. They need to show who produced each result, with which method version, and who approved it. Because we cover the whole workflow, that record does not break between tools.
Audit trails
Every change to a method, a dataset or a result is recorded with who, what, when and why, and the record itself cannot be edited.
Electronic signatures
Signatures are linked to the record they sign, state their meaning such as reviewed or approved, and require the signer’s own credentials.
Method versioning
Analysis methods are locked and versioned, so last year’s data can be re-run with exactly the method that produced it.
| Time | User role | Action | Reason |
|---|---|---|---|
| 08:12:04 | Method owner | Method Grain size v3.2 released | Threshold update, CR-031 |
| 10:41:57 | Operator | Images B-114 (24) imported, checksum stored | Routine QC |
| 10:42:31 | Operator | Result 12.61 µm calculated with v3.2 | Routine QC |
| 10:46:10 | Operator | Image 17 excluded, original kept | Out of focus |
| 11:03:22 | QC reviewer | Signed: Reviewed | Batch release |
| 11:20:48 | QA manager | Signed: Approved | Batch release |
Industries
Built for the labs we know best
We work with research groups and production QC in four fields. These are the measurements we set up most often.
Materials science
- Grain size measurement ASTM E112
- Grain structure analysis
- Phase fractions and porosity
- Non-metallic inclusion rating
Life science
- Cell counting and confluence
- Tissue area fractions in histology
- Particle sizing for formulations
- GLP-ready result records
Manufacturing & QC
- Automated defect detection
- SPC on measured features
- Process capability Cp / Cpk
- Six Sigma projects
Geoscience
- Mineral classification
- Pore networks in core samples
- Grain shape and sorting
- Thin-section analysis
How we work
Try it on your own samples before you spend a cent
Your challenge
We look at your samples, your method and your rules, and map what happens to an image today, from capture to report.
Proof of concept
We run the solution on your own images and data, so you can check the numbers before you place an order.
Support and training
Deployment, hands-on training, maintenance and fast support for the whole workflow, not just one piece of it.
A 30-minute call is enough to scope it.
Clients
What our clients say
I started working together with SciSpot and the software MIPAR two years ago, and since then, I’ve enjoyed a fast and always helpful support. I really enjoy their full-service offer.
I have been working with so many foreign partners for many years. SciSpot is one of the most professional partners. They respond quickly and are very helpful.
We have been using the software MIPAR in our research for more than a year. It is a great software that is easy to work with thanks to the outstanding support SciSpot offers.
Events
Meet us at the conferences
Nine congresses since 2022, with talks, posters and live demos. Next stops: Dresden and Aalen.
Latest recaps
One partner for all your scientific software
Why is our name on your invoice?
Many organisations buy software through a large framework-agreement provider. For scientific and engineering software, that provider works with us. We deliver the licences, install them, answer your support questions and make sure renewals happen on time, all under the agreement you already have.
Delivery and installation
Licences, licence servers and first set-up, done by people who use the software themselves.
Support that understands the science
Questions about methods and results, as well as installation and licensing.
One renewal calendar
We track maintenance and renewals across your scientific software, so nothing lapses in the middle of a project.
The right number of seats
We review how the licences are actually used and help you adjust at renewal.
Bring us your ugliest image
Blurry, crowded or badly lit, we have seen worse. Tell us what you need to measure and which rules you work under, and we’ll show you how much of the workflow can run on its own.