
Particle size and shape analysis · ISO 13322-1
Particle size and shape. Every particle, not just an average.
Laser diffraction gives you one curve and assumes every particle is a sphere. Image analysis measures each particle you can see: its size, its shape, and whether it’s really one particle or five stuck together. MIPAR splits touching particles and measures them one by one, the same way on every batch.
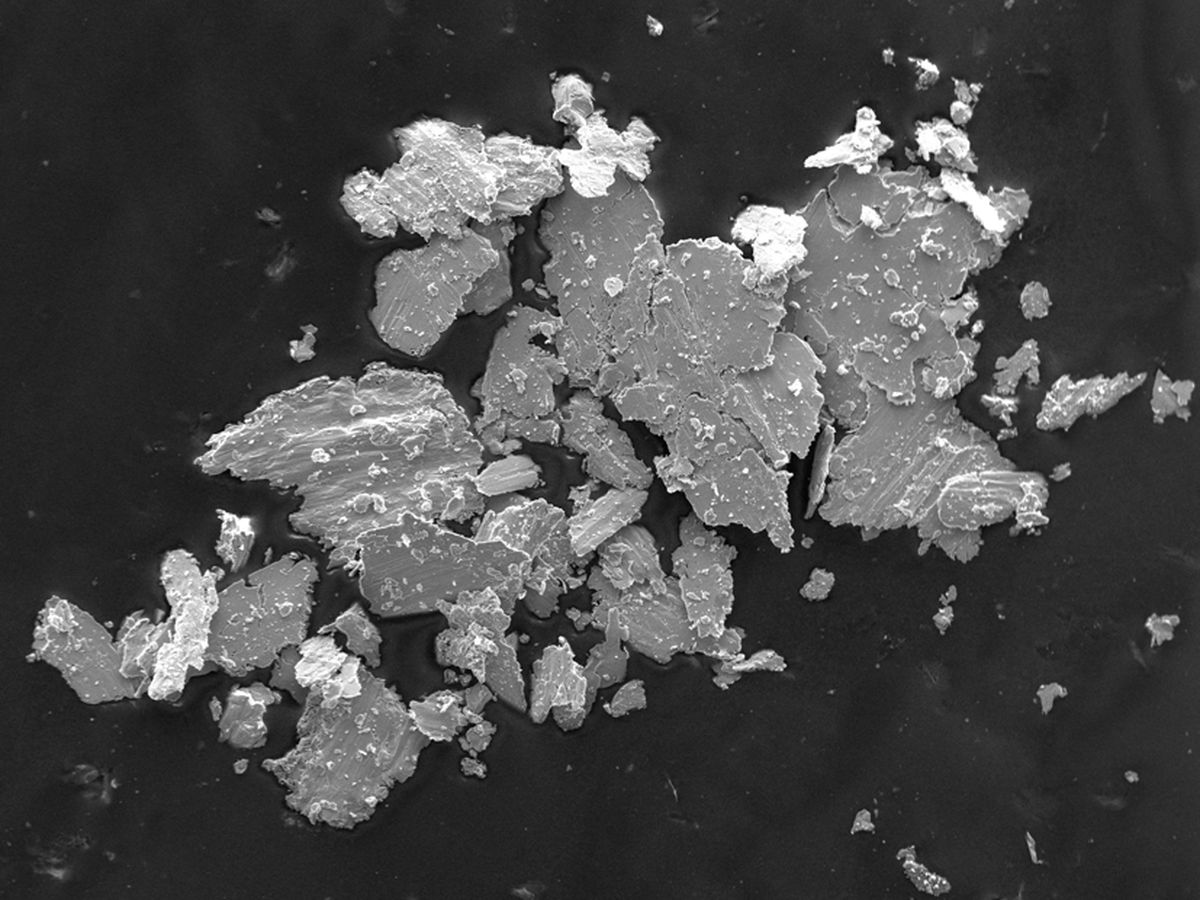
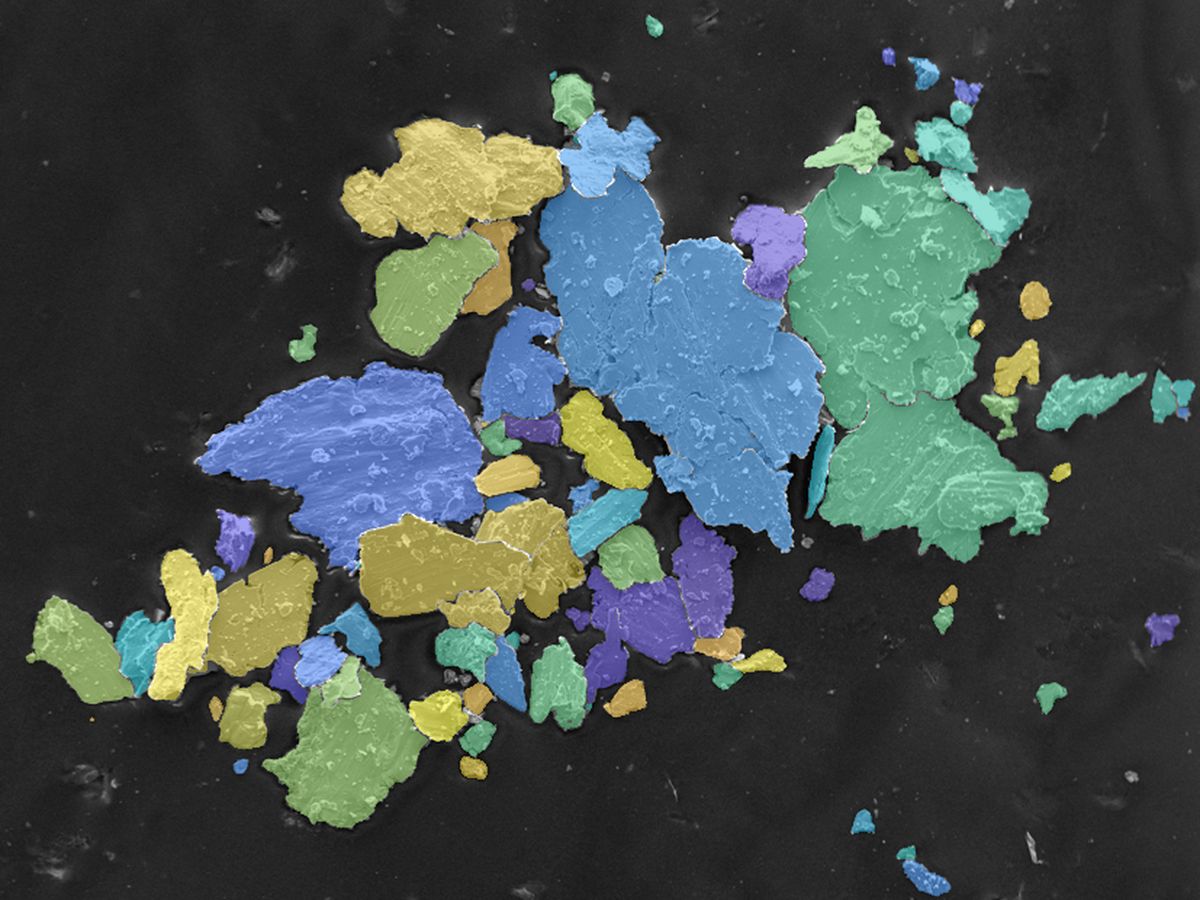 SEM imageEvery particle found
Irregular powder, SEM. Touching particles split apart and measured one by one. Drag the slider.
Used on
- Metal powders for additive manufacturing
- Ceramic powders
- Pharmaceutical powders
- Battery materials
- Pigments and abrasives
- Nanoparticles
- Sand and minerals
Size distributions
Same powder, three different D50s. All of them correct.
The number you get depends on how particles are weighted and on whether a clump counts as one particle or several. Flip the switches and watch D10, D50 and D90 move on the same simulated powder.
single particle agglomerate
Simulated powder of about 2,000 particles, sized as equivalent circle diameter. Laser diffraction reports by volume, image analysis counts by number, and the two can be converted.
Particle shape · ISO 9276-6
Two powders, same D50. One flows, one doesn’t.
Size is only half the story. Round, smooth particles pack and flow well; flakes, satellites and sharp edges don’t. That decides how a powder spreads in an AM machine, presses into a tablet or mixes into a paste. Pick a particle type, or shape your own, and see the shape factors calculated live.
Calculated from the outline in your browser. Dashed line: convex hull. Arrows: maximum and minimum Feret diameter.
Which method?
Laser diffraction, sieving or image analysis
Each one answers a slightly different question. Many labs keep laser diffraction for the daily number and add image analysis when they need to know why a batch behaves differently.
What can go wrong
Six ways a particle count fools you
The maths behind D50 is simple. Deciding what counts as a particle is not. Here’s how we handle each trap when we set up a recipe.
Touching particles
Two particles that touch get measured as one big one, and D90 jumps.
Watershed splitting or deep learning separates them.
Real agglomerates
Sometimes the clump is the finding. Splitting it hides a dispersion problem.
We report both: primary particles and agglomerates.
Too few particles
D90 is decided by a handful of large particles. Measure too few and it jumps between repeats.
Batch processing many fields makes thousands of particles routine.
Too few pixels
A particle only a few pixels across has no reliable size or shape.
We set a minimum size per magnification, and combine magnifications if needed.
Particles cut by the edge
A particle sliced by the image border looks smaller than it is.
Edge particles are excluded or corrected for.
Poor dispersion
Particles piled on top of each other can’t be measured, whatever the software.
We help you with sample preparation as part of the setup.
From sample to report
How we set it up in your lab
- 1 · Acquire
Dispersed and calibrated
SEM, light microscope or a flatbed scan of coarse particles, with a stored scale and a preparation method that keeps particles apart.
- 2 · Analyse
A MIPAR recipe
Detect, split touching particles, exclude edges, measure size and shape. See how recipes work.
- 3 · Report
D-values, shape and graphs
D10, D50, D90, span and shape distributions per batch. Trend them in OriginPro, next to your laser diffraction data.
- 4 · Comply
Traceable results
Audit trail and sign-off where you need them. See our data compliance service.
Questions
Particle size analysis, answered
Why is our image analysis D50 different from laser diffraction?
Usually for three reasons. Laser diffraction weights by volume and image analysis by number, which moves D50 a lot for broad distributions. Laser diffraction assumes spheres, so elongated particles come out differently. And the two methods treat agglomerates differently. Converted to the same weighting, the results normally line up, and the differences that remain tell you something about shape.
Which particle size do you report?
Most often the equivalent circle diameter (ECD): the diameter of a circle with the same area as the particle. We can also report minimum and maximum Feret diameter, which matter for elongated particles and sieving.
How many particles do we need to measure?
It depends on how broad the distribution is and which value you need. D50 settles quickly. D90 and the coarse tail need many more particles, because a few large ones decide them. With batch processing over many fields, measuring thousands of particles is routine.
Can you separate particles that touch?
Yes. Touching particles are split with watershed separation or a deep learning model trained on your images. Real agglomerates can be reported separately, so you see both the primary particle size and how well the powder disperses.
Does it work for nanoparticles?
Yes, on SEM and TEM images. The method is the same; only the magnification and the preparation change.
Can you test our own images first?
Yes. Send us three typical images with the scale, and your laser diffraction result if you have one. We’ll return size and shape distributions and a short comparison. It’s free. Measuring microstructures too? See grain size to ASTM E112.
Send us three images. Get size and shape back.
Include the scale and, if you have it, your laser diffraction result. We’ll walk you through both side by side in a short call.