Powerful Statistical software everyone can use

Harness the power of statistics
Data is everywhere, but are you truly taking advantage of yours? Minitab Statistical Software can look at current and past data to discover trends, find and predict patterns, uncover hidden relationships between variables, and create stunning visualizations to tackle even the most daunting challenges and opportunities.
With powerful statistics, industry-leading data analytics, and dynamic visualizations on your side, the possibilities are endless.
Cloud / Desktop
Predict

Achieve

Predictive Analytics & Machine Learning
Our proprietary, best-in-class machine learning algorithms have the power to provide deeper insights in your data.
What is predictive analytics? It is a category of data analytics aimed at making predictions about future outcomes based on historical data and analytics techniques. Predictive analytics uses a variety of statistical techniques (including data mining, machine learning, and predictive modeling) to understand future occurrences. Learn more>

Automated, Real-time Analytics
True Analytics Dashboards – Business is evolving, and so should your dashboards. Leverage Live Analytics for automated, differentiated insights and go beyond simple business intelligence visualizations.
Make it easy for your power users, scientists, and engineers to deliver more advanced analyses to help you make better business decisions. Now everyone in your organization can transform their data into knowledge on a convenient and shareable platform. Learn more>
Supply Chain
Leverage the power of data analysis to tackle challenges in
your supply chain with Minitab’s Supply Chain Module.
Shift your focus to improving key performance indicators (KPIs) like cycle time, inventory, delivery, quality, profitability, and costs without worrying about which analysis to use. Learn more >


Discover
Regardless of statistical background, Minitab empowers all parts of an organization to predict better outcomes, design better products, and improve processes to generate higher revenues and reduce costs. Only Minitab offers a unique, integrated approach by providing software and services that drive business excellence from anywhere with the cloud.
Key statistical tests include t tests, one and two proportions, normality test, chi-square, and equivalence tests.
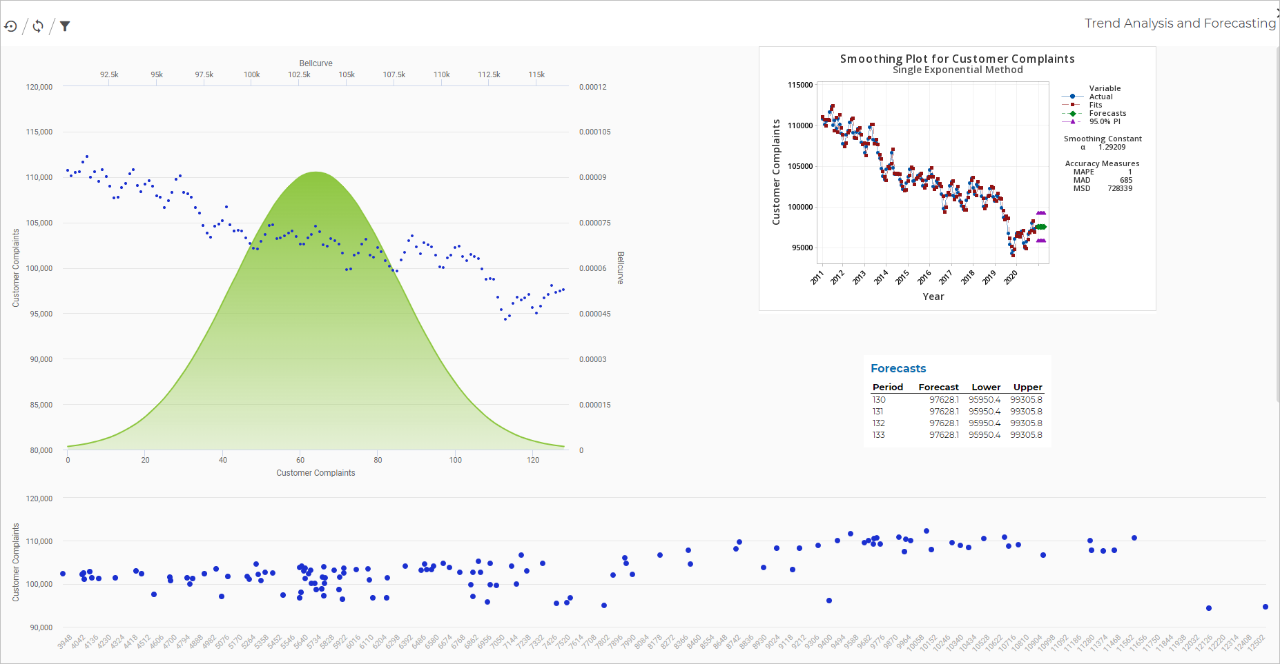
Predict
Access modern data analysis and explore your data even further with our advanced analytics. Skillfully predict, compare alternatives, and forecast your business with ease using our revolutionary predictive analytics techniques.
Use classical methods in Minitab Statistical Software, integrate with open-source languages R or Python, or boost your capabilities further with machine learning algorithms like Classification and Regression Trees (CART®), TreeNet® and Random Forests®, now available in Minitab’s Predictive Analytics Module.

Achieve
Seeing is believing. Visualizations are critical to accurately communicate findings and achievements. Deciding which graph best displays your data and supports your analysis is fast and easy with Graph Builder.
Our new interactive tool with an easy-to-browse gallery lets you view and explore multiple graph options without re-running your analysis. Using the same selection of data each time, Graph Builder seamlessly updates from bar charts to correlograms to heat maps and more, so you can focus on choosing the best visual for your insights.
Healthcare Module
Written with healthcare professionals in mind, Minitab’s Healthcare Module provides guided data analysis in commonly-used and understood healthcare terms. Shift your focus to improving key performance indicators (KPIs) like wait time, costs, utilization, patient safety, and patient satisfaction without worrying about which analysis to use. Learn more >

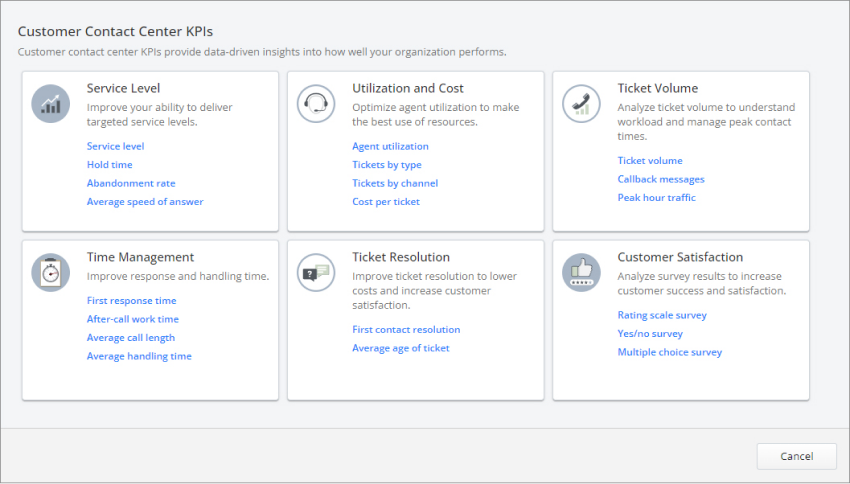
Customer Contact Center Module
Written with contact center professionals in mind, Minitab’s Customer Contact Center Module provides guided data analysis is commonly used and understood terms. Shift your focus to improving key performance indicators (KPIs) like service levels, utilization and cost, ticket volume, time management, ticket resolutions, and customer satisfaction without worrying about which analysis to use.
Learn more>
And so much more...
SWOT Analysis, Gantt Chart, Meeting Minutes, CTQ Trees, Five Whys, Idea Map, SIPOC, Audit Plan, Control Plan…
Ready for a demo of Minitab Statistical Software?
Data Transfer
Data access, automation, and governance for comprehensive insights

Online Stat Training

Master statistics and Minitab
anywhere with online training.

Project Ideation & Execution
Start, track, manage, and execute
innovation and improvement initiatives.